Pyrite
Pyrite: MPI Communication Tracking and Visualiser
Pyrite is a lightweight MPI tracing and visual analytics toolchain for HPC applications.
This project intercepts MPI communication at runtime, records a compact binary trace, converts it into a streamed visualisation format, extracts common communication patterns and likely performance problems, and provides a web based rendering tool to display the result on a 3D representation of your physical hardware topology.
Features
- Zero-code instrumentation with
LD_PRELOAD - Low-overhead PMPI interception
- Compact binary trace output (
.mpic) - Chunked, streamed visualisation format (
.mpix) - Support for blocking, nonblocking, and collective MPI calls
- Analysis of communication patterns and performance issues
- 3D hardware-aware visualisation in the browser
- Persistent 3D analytics overlays
- Issue-card-to-3D isolation
- Optional Fortran test coverage
Visualiser Interface
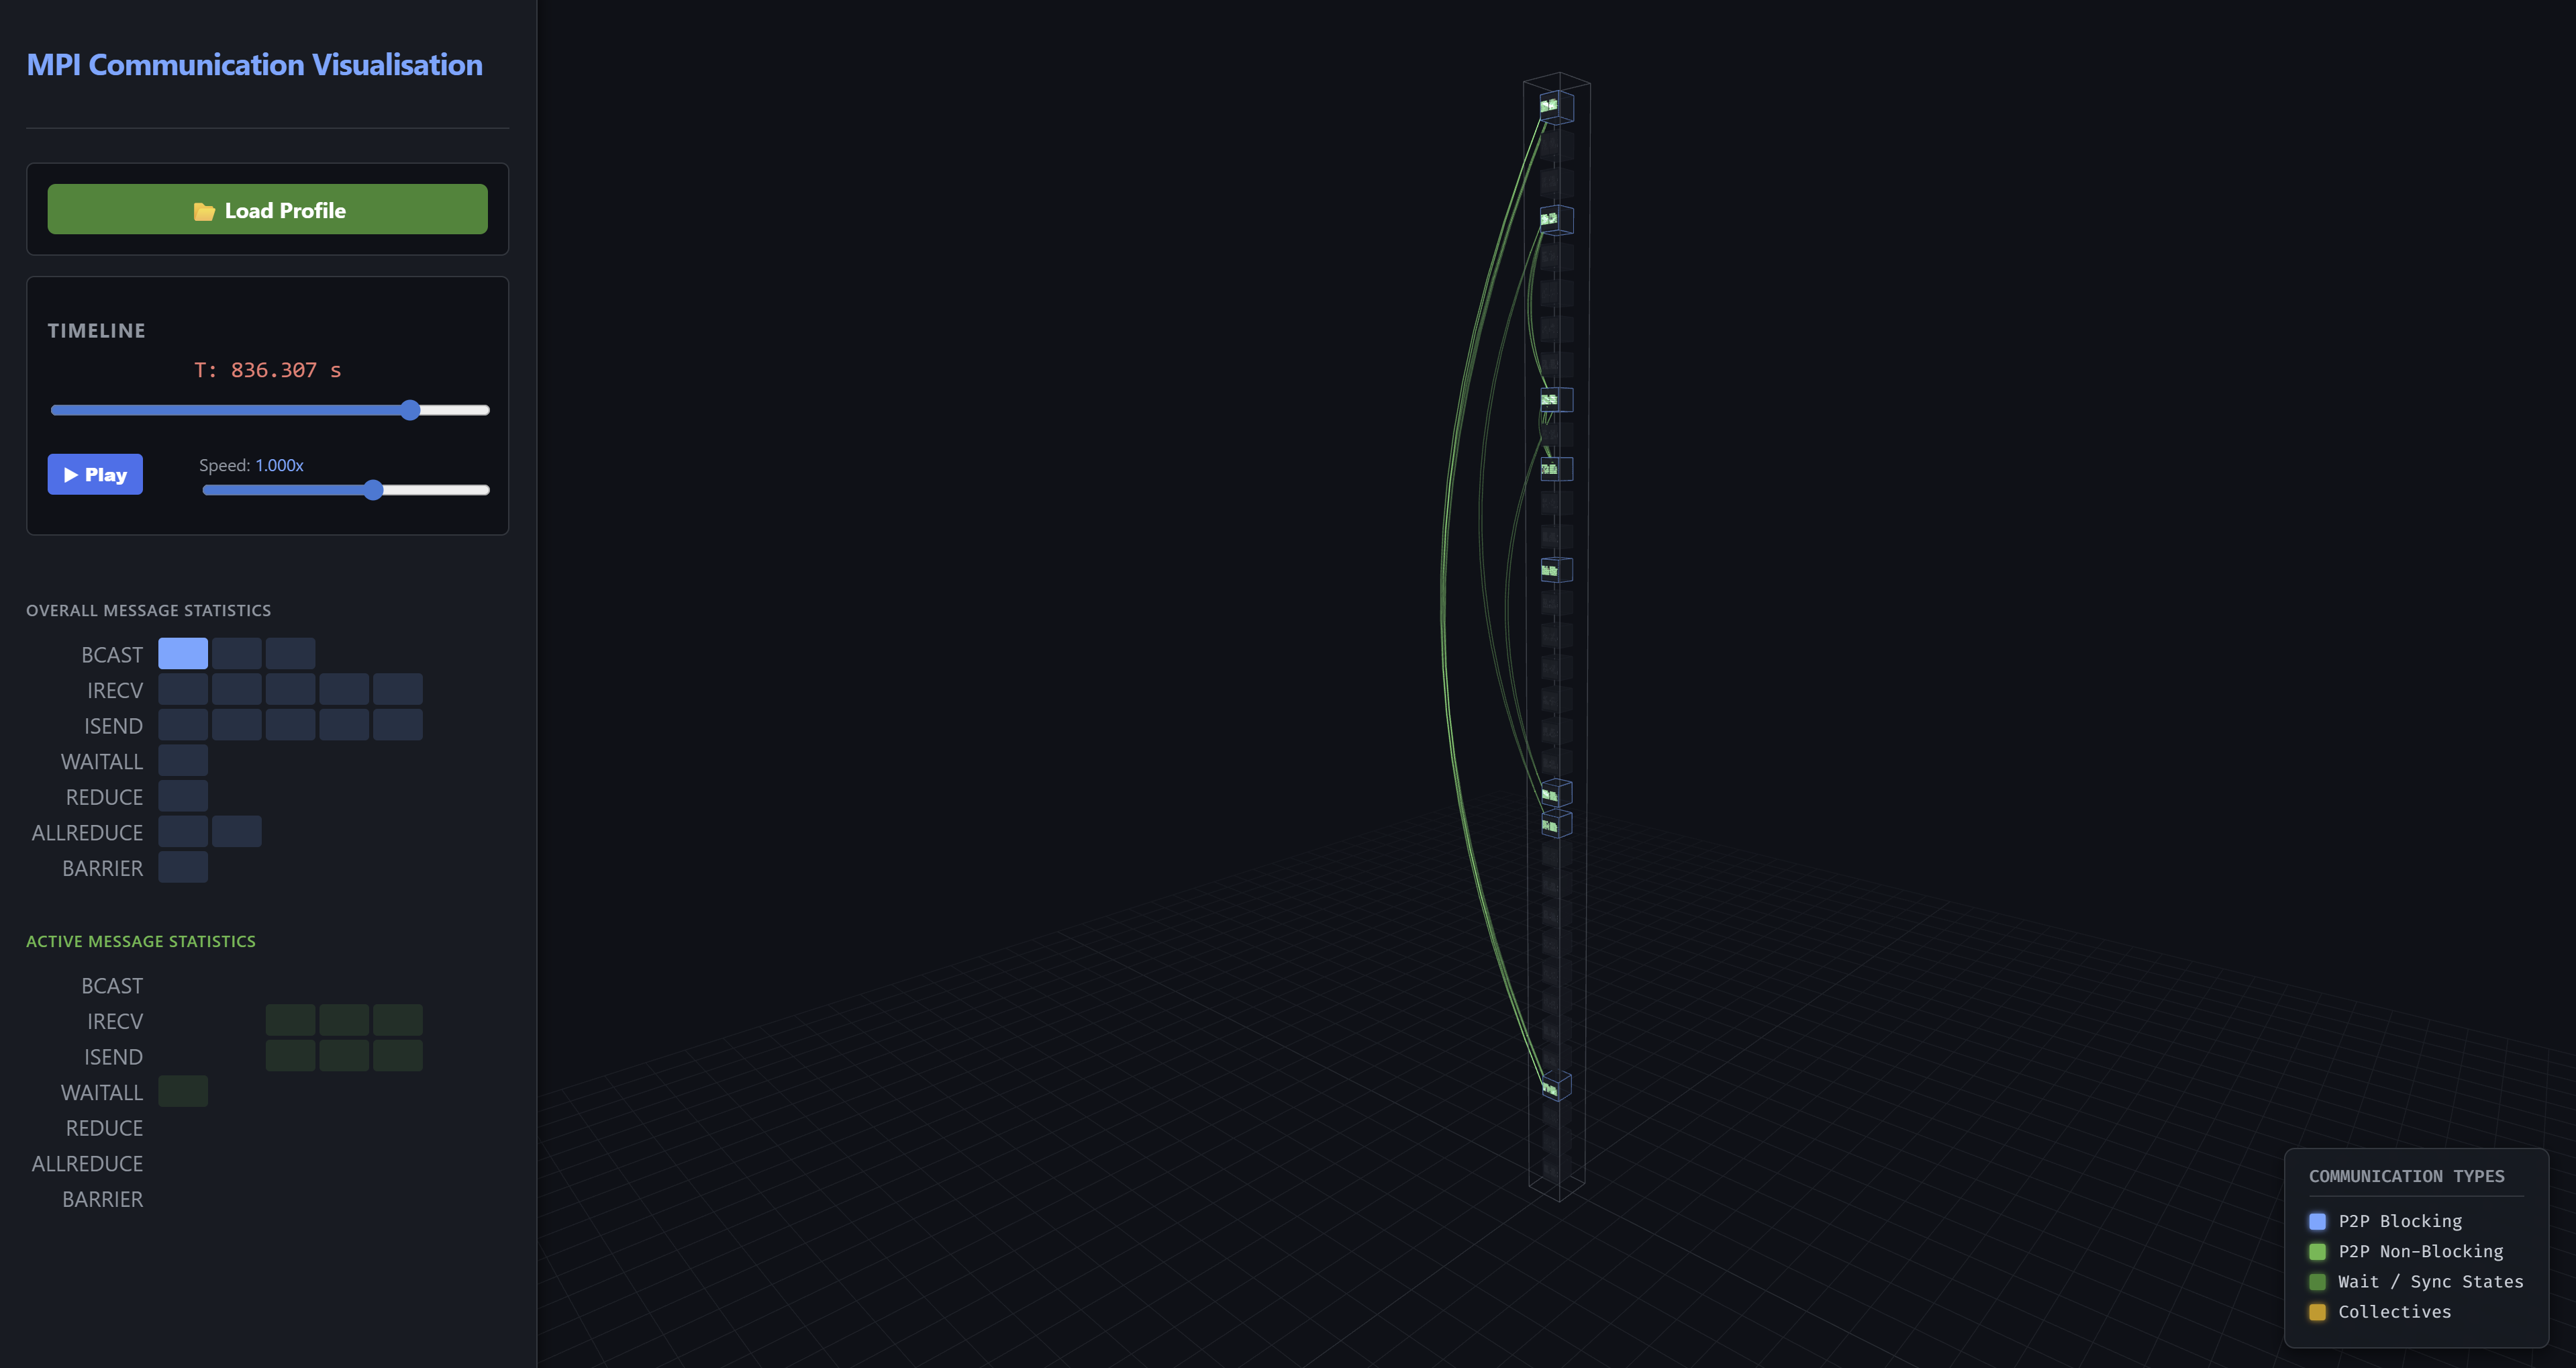 The web-based visualiser rendering core-to-core network traffic using physical 3D tubes and directional arrowheads, alongside live message statistics and analytics overlays.
Project Layout
mpi-comm-tracker/
├── CMakeLists.txt
├── src/
│   ├── CMakeLists.txt
│   ├── mpi_communication_tracking.c
│   └── mpi_communication_tracking.h
├── tools/
│   ├── mpi_data_parser.py
│   ├── topology_generator.py
│   └── slurm_topology_generator.py
├── vis/
│   ├── index.html
│   ├── style.css
│   ├── visualiser.js
│   ├── analytics.js
│   ├── analytics-3d.js
│   └── analytics-controls.js
├── tests/
│   ├── CMakeLists.txt
│   ├── ctest_driver.py
│   ├── trace_parser.py
│   ├── test_*.c
│   └── test_*.f90
└── docs/
    └── developer-guide.md
Quick Start
1. Build
mkdir build
cd build
cmake ..
make
This produces:
build/src/libmpi_comm_tracker.so
2. Run an MPI application under the tracker
LD_PRELOAD=/path/to/build/src/libmpi_comm_tracker.so mpirun -n 16 ./your_mpi_application
At MPI_Finalize, rank 0 writes a trace file like:
your_mpi_application-YYYYMMDDHHMMSS.mpic
3. Generate or provide a hardware map
Optional, but recommended for meaningful 3D placement.
From Slurm
scontrol show topo > my_topo.txt
python tools/slurm_topology_generator.py my_topo.txt --racks_per_cab 4 --out hardware_map.json
Synthetic
python tools/topology_generator.py \
  --cabinets 2 \
  --racks 2 \
  --nodes 16 \
  --cpus 2 \
  --cores 32 \
  --system_name "My Local Cluster"
4. Parse and analyse the trace
python tools/mpi_data_parser.py your_mpi_application-YYYYMMDDHHMMSS.mpic hardware_map.json
This creates:
your_mpi_application-YYYYMMDDHHMMSS.mpix
5. Open the visualiser
Open:
vis/index.html
Then load the generated .mpix file.
What the Parser Produces
The .mpix container includes:
- metadata
- topology
- binned message statistics
- hardware blueprint
- extracted analytics
- compressed time chunks
The analysis layer includes:
- top communicating ranks
- hottest sender/receiver links
- collective root summaries
- barrier skew estimates
- time-window / phase summaries
- detected communication patterns
- heuristic performance issues
Visual Analytics
The frontend provides:
- a 3D hardware view
- timeline playback
- overall and active message statistics
- analytics cards
- persistent 3D overlays for:
- issue-related ranks
- hotspot links
- collective roots
- top ranks
- pattern-related highlights
- issue-card-to-3D isolation
- analytics legend and highlight filters
Supported MPI Calls
Point-to-point
MPI_SendMPI_RecvMPI_BsendMPI_SsendMPI_RsendMPI_IsendMPI_IbsendMPI_IssendMPI_IrsendMPI_IrecvMPI_Sendrecv
Completion / synchronization
MPI_WaitMPI_WaitallMPI_WaitanyMPI_WaitsomeMPI_TestMPI_TestanyMPI_TestallMPI_TestsomeMPI_Barrier
Collectives
MPI_BcastMPI_ReduceMPI_AllreduceMPI_GatherMPI_ScatterMPI_Allgather
Running Tests
cd build
ctest --output-on-failure
Optional Fortran test support:
cmake -S . -B build -DMPI_TRACE_FORTRAN_TESTS=AUTO
cmake -S . -B build -DMPI_TRACE_FORTRAN_TESTS=ON
cmake -S . -B build -DMPI_TRACE_FORTRAN_TESTS=OFF
Limitations
- Communicator identity is not yet stored explicitly in the trace format, meaning we only record global ranks for communications and do not differentiate between communicators
- Some collective behaviour is approximated in the visualisation to make it visible
- The analytic functionality is currently based on heuristic approaches, not formal proof based functionality
- Persistent MPI requests are not yet fully modelled
- Thread safety/heavy
MPI_THREAD_MULTIPLEusage is not yet tested or ensured
Documentation
For internal details, trace format notes, parser behaviour, frontend module layout, analytics overlays, testing, and extension guidance, see docs/developer-guide.md.
Authors
This has been developed by Adrian Jackson.
License
Apache 2.0. See LICENSE.